
Good cash flow is essential for a successful business; therefore monitoring and working to improve those cash flow metrics is crucial. The majority of small business owners struggle with cash flow and many fail because of it, but there are several cash flow metrics and KPIs that you can (and should) track to help.
Cash flow metrics can help you understand your current financial position and help you make better-informed decisions, instead of blankly staring at your financial statements. You can also spot issues before they become a bigger problem and allow you to adjust accordingly.
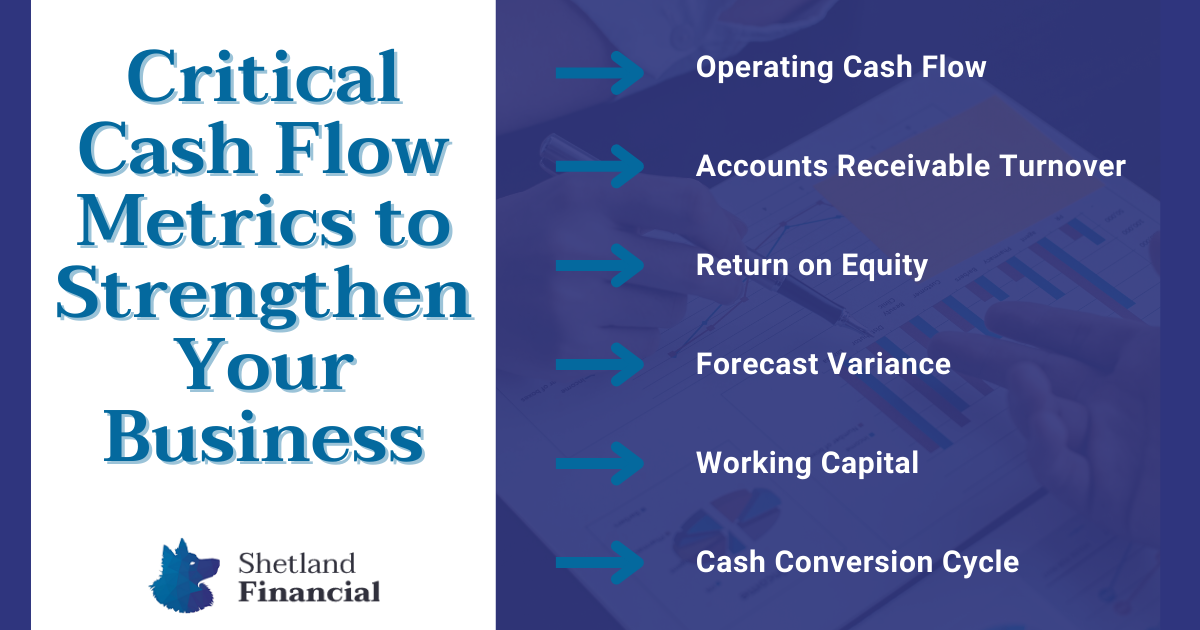
In this post, we’ll review the cash flow metrics you should be looking at. Find out what each one tells you about your business and how to calculate it.
Operating Cash Flow Metrics (or Cash Flow from Operations)
Operating cash flow (or cash flow from operations) measures the cash a company generates from its core business activities, such as selling goods or providing services.
A good operating cash flow indicates that the core business on its own is sufficient enough to support the business without additional loans or outside investment and is an indicator of the sustainability of your business.
Cash flow from operations = net income + non-cash items + changes in working capital
Operating cash flow expressed as a ratio is calculated by taking current liabilities divided by operating cash flow.
A minimum operating cash flow ratio of 1 ensures you have the cash to cover short-term debts.
Accounts Receivable Turnover
Accounts receivable turnover measures the rate or efficiency your company collects debt from your customers.
Accounts receivable turnover = net credit sales/average accounts receivable
Ideally, you want to have a high turnover rate. This would mean you are collecting those payments from your customers quickly. A low rate would indicate that customers are not paying on time or you have difficulty collecting from them altogether. This could suggest that you need to adjust your payment terms or look into potential customer relationship issues.
Return on Equity
Return on equity measures the shareholder’s return from your business on their investment.
Return on equity = net income / average shareholders equity x 100
A high ROE indicates how well a company converts its investors’ money into profits.
A low ROE for an extended period suggests the company is less efficient at generating profit. It may also indicate to investors that the business is not worth investing in as management cannot make good use of investors’ money.
Forecast Variance
Forecast variance is a comparison of your projected numbers to your actuals. This is why it’s essential to have a budget. Variances help you understand where your business went off track with your budget so you can make adjustments to get back on track before the end of the year.
Forecast variances are typically used to compare sales actuals vs forecast and expense budgets vs actuals, impacting cash flow.
Forecast variance = forecasted value – actual value / forecasted value
Decide on a reasonable threshold of variances between forecasted and actual income and expenses, which will vary by business that should be investigated.
Working Capital
Working capital is a measure of liquidity, showing how quickly a company can generate cash to pay current debts or invest in growth opportunities. It showcases your business’s operational efficiency and short-term financial health, including having the flexibility to cover emergencies or withstand market changes like inflation.
Working capital = current assets – current liabilities
The numbers you need are found on the balance sheet. Calculate your available working capital by subtracting your current liabilities (debts due within a year, such as accounts payable and bank overdrafts) from your current assets (cash and other assets that can be quickly converted into cash).
A working capital ratio greater than one means that your company can pay its current liabilities. Your business is at risk if your current liabilities outweigh your current assets. If your business has significant working capital, you can move into additional investment opportunities and grow.
Cash Conversion Cycle (CCC)
Cash conversion cycle is how much time it takes to convert your inventory and other resources into cash flows from sales, considering how much time it takes to collect receivables and pay bills.
CCC combines three metrics:
- Days inventory outstanding (DIO) — the number of days, on average, it takes for your inventory to turn over.
DIO = average inventory/cost of goods sold x number of days
- Days sales outstanding (DSO) — the number of days, on average, it takes to collect your receivables.
DSO = accounts receivable x number of days / total credit sales
- Days payable outstanding (DPO) — the number of days, on average, it takes you to pay your vendors and suppliers.
DPO = accounts payable x number of days/cost of goods sold
It is then calculated using those metrics:
CCC = DIO + DSO – DPO
A low (or even negative) CCC is good because it indicates that your inventory sells quickly and your customers pay their invoices sooner rather than later, which is important for a healthy cash flow. This ensures your working capital is not tied up too long, so you can pay your vendors on time and invest in more inventory.
Tracking the Right Cash Flow Metrics is Critical for Strengthening Your Business
When you prioritize and track these cash flow metrics, you can see changes over time, which could point to cash flow problems before they become a more significant issue.
While tracking cash flow metrics like the ones covered above will provide you with some of the numbers you need for proper cash flow management, outsourcing your accounting can help you achieve your goals faster.
At Shetland Financial, we will ensure you track and prioritize the right cash flow metrics so your business can continue growing. Contact us today to learn more about how we can help!